
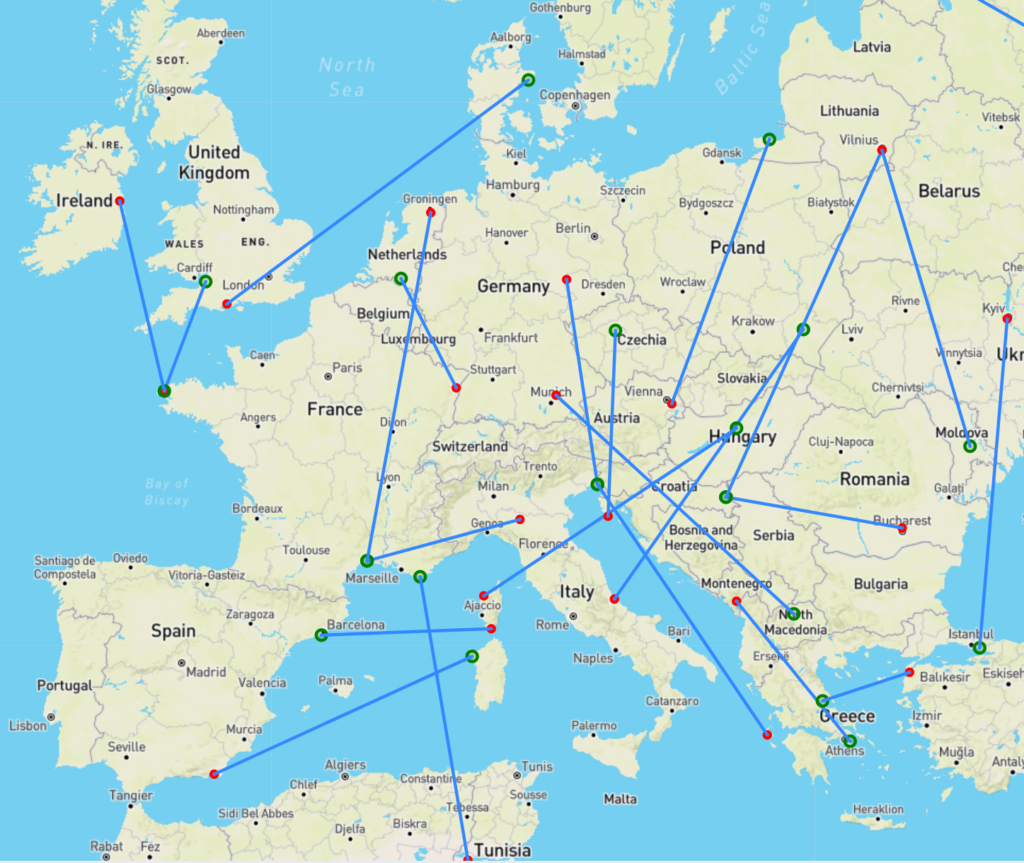
I love flying around in flight simulators. As fun as it is to fly around and try to figure out procedures, it’s rarely a game as such. There are no missions, no goals, no penalty for mistakes. FSEconomy is a plugin for flight simulators which adds a layer of gamification by enabling users, among others, to rent and buy aircraft and fly existing missions in order to earn more in-game currency. Users can own small planes and fly them anywhere, but large aircraft are tied to specific missions. Since there is no easy way to find these missions, I decided to spend a bit of time developing a plotting tool for FSEconomy, which displays the missions on a map.
Initially just a simple map with a field for the access key and a drop-down for the plane, I quickly realised I need to be as transparent as possible since people are entrusting their private API keys. I, therefore, made the project open source and added a pop-up modal to explain why it needs your key. I also use a proxy due to CORS which I disclose there.
After launching the site and posting on the FSEconomy Discord, I received good feedback and suggestions for improvement. I quickly implemented the ability to go to the FSEconomy airport page after clicking on the airport, and optional cookies which remember your key and selections for next time.
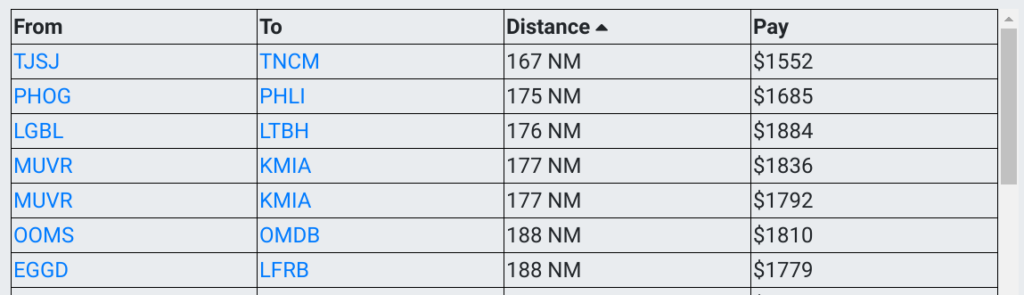
I deliberately decided to not use any web frameworks for development. Like many others, I’m sick of bloated websites when it’s just not necessary. In order not to add to the pool, I kept it simple and only used Bootstrap, JQuery and Leaflet. When I started implementing the functionality to display all missions in a sortable table, I almost regretted my decision. I proceeded to put hours of work into reorganising my code, HTML, and making sure the CSS animations don’t break. Sorting is performed by erasing the table and re-adding the data.
Screenshots
You can find the code for the plotting tool for FSEconomy on my GitHub. It is also currently live on fseplot.gravila.dev.