
The K-means algorithm is a simple clustering algorithm. It is an unsupervised learning algorithm, therefore it automatically finds structure in unordered data. Since TensorFlow does not have a native implementation, it’s useful to know the tips and tricks to implement K-means.
I’m hoping to use K-means in an upcoming post, so I want to explain it to anyone who might be unfamiliar. Additionally, make sure to read my posts about shapes (intro and closer look) if you’re unfamiliar with them since this algorithm makes heavy use of understanding the concept.
K-means is a simple algorithm once you understand it. Its idea is to instantiate a centroid (a point in the same feature space as the data) for each expected class. Following this, iteratively move them towards the coordinates that best represent the respective class. Predicting what class a new data point belongs to is as simple as finding the closest centroid in the feature space.
The algorithm begins by initialising k centroids. Conventionally they will be set as k random data points. The iterative algorithm runs as follows:
initialise k centroids using k random datapoints
while not converged:
    assign each data point to its closest centroid based on distance
    for each centroid:
       compute the mean between all data points assigned to it
       update the centroid so that its coordinates are the previously calculated mean
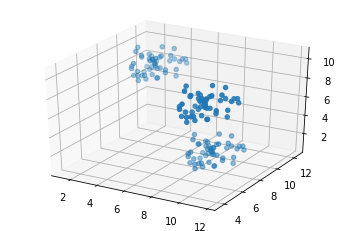
As simple as the algorithm is, it’s not trivial to take advantage of the power of tensorflow in order to efficiently compute it. The following is code by Sergey Kovalev, Sergei Sintsov, and Alex Khizhniak from their post, Implementing k-means Clustering with TensorFlow, which I have expanded with step-by-step comments explaining each line. Additionally, I am creating three random uniform distributions to give k-means something more illustrative to predict. Finally, I improve the plotting by allowing both 2D and 3D visualisations, and by drawing a line showing the paths of the centroids.
import tensorflow as tf
import numpy as np
import matplotlib.pyplot as plt
from matplotlib.colors import BASE_COLORS
import random

seed = 0
# set the random seed so numpy always generates the same random data
np.random.seed = seed

points_n = 150
clusters_n = 3
dimensions = 3

batch = tf.constant([])

points = []
for c in range(clusters_n):
  tf.random.set_seed(5)
  # get a random uniform distribution, and multiply by 3 so it's bigger on the graph
  dist = tf.multiply(tf.random.uniform((points_n//clusters_n, dimensions), seed=seed), 3)
  # shift it
  rand_shift = np.random.uniform(0, 10, (1, dimensions))
  dist_adj = tf.add(dist, rand_shift)
  points.append(dist_adj)

# concatenate the points list as a tensor
points = tf.concat(points, axis=0)

# plot in 2d if 2d, else the first 3 dimensions in 3d
fig = plt.figure()
if dimensions == 2:
  ax = fig.add_subplot(111)
  ax.scatter(points[:,0], points[:,1])
elif dimensions > 2:
  ax = fig.add_subplot(111, projection='3d')
  ax.scatter(points[:,0], points[:,1], points[:,2])
# initialise centroids as coords of first 3 points
centroids = tf.slice(tf.compat.v1.random_shuffle(points), [0, 0], [clusters_n, -1])
# expand the dim for convenience later in tf.subtract
# points_expanded dims (1, points_n, dimension)
points_expanded = tf.expand_dims(points, 0)
@tf.function
def update_centroids(points_expanded, centroids):
# expand the second dimension, again, for convenience in tf.subtract
# centroids_expanded dims (clusters_n, 1, dimension)
centroids_expanded = tf.expand_dims(centroids, 1)
# due to broadcasting, tensorflow broadcasts the 1-sized dimensions to fit the other tensor
# I'll use dimension=2 and centroids=3 in the following for clarity:
# points_expanded (1, points_n, 2)
# centroids_expanded (3, 1, 2)
# points_expanded is stretched 3 times since its first dimension is 1:
# points_expanded (3, points_n, 2) # 3 of the same
# centroids_expanded (3, 1, 2)
# centroids is stretched points_n times in the same way
# points_expanded (3, points_n, 2)
# centroids_expanded (3, points_n, 2) # now we have points_n of each centroid
#
# exactly what we want! For each centroid, we subtract it from all points
# we are left with clusters_n tensors, each of shape (points_n, dimensions)
distances = tf.subtract(centroids_expanded, points_expanded)
# then we square it
distances = tf.square(distances)
# finally, we want the cartesian distance, so we add the two squares together
# reduce_sum reduces the given dimension (2 is last) by summing
distances = tf.reduce_sum(distances, 2)
# argmin returns the index of the minimum number
# found on the given axis (first)
# in other words, the closest centroid
assignments = tf.argmin(distances, 0)
means = []
# for each cluster
for c in range(clusters_n):
# tensor of same shape as assignments where value=True if
# assignments value == c
# if it is closest to the centroid in question
eq_eq = tf.equal(assignments, c)
# tensor that only contains the indeces from eq_eq that were True
# [True, False, False, True] -> [[0],[3]]
where_eq = tf.where(eq_eq)
# reshapes (matches_found, 1) to (1,matches_found)
# It can be rewritten to reshape to (-1,)
# then make sure to reduce_mean on axis 0
# the extra dimension is to match the shape of centroids
ruc = tf.reshape(where_eq, [1,-1])
# gets the points by the indices previously found
ruc = tf.gather(points, ruc)
# gets the averages for each dimension of all points
ruc = tf.reduce_mean(ruc, axis=[1])
# we have the values for the new centroid
# add it to the list
means.append(ruc)
# concatenate the centroids in the list to one tensor
new_centroids = tf.concat(means, 0)
return new_centroids, assignments
fig = plt.figure()
if dimensions == 2:
ax = fig.add_subplot(111)
elif dimensions > 2:
ax = fig.add_subplot(111, projection='3d')
# k-means converges, let's go until then
# save the old centroid
old_centroids = centroids
while True:
# perform one step
centroids, assignments = update_centroids(points_expanded, centroids)
# check if the old centroids are identical to the new ones
# if yes, we are done
if tf.reduce_all(centroids == old_centroids):
break
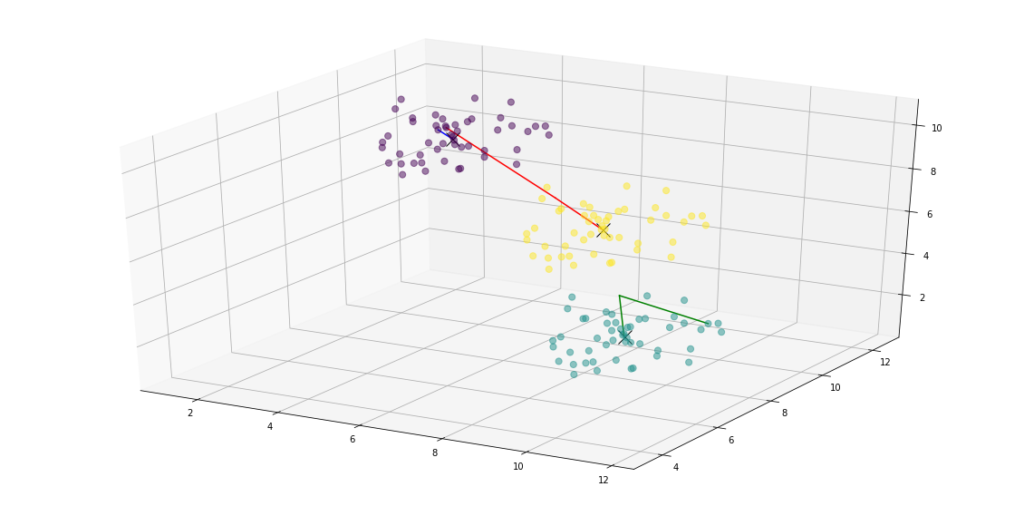
# print a line from the old centroid to new so it's pretty
for o,c,k in zip(old_centroids, centroids, BASE_COLORS):
if dimensions == 2:
ax.plot([o[0], c[0]], [o[1], c[1]], c=k)
elif dimensions > 2:
ax.plot([o[0], c[0]], [o[1], c[1]], [o[2], c[2]], c=k)
# save the current centroids for future comparison
old_centroids = centroids
if dimensions == 2:
# plot all the dots colored as their final assignments
ax.scatter(points[:, 0], points[:, 1], c=assignments, s=50, alpha=0.5)
# plot the final centroids as an X
ax.plot(centroids[:, 0], centroids[:, 1], 'kx', markersize=15)
elif dimensions > 2:
ax.scatter(points[:, 0], points[:, 1], points[:, 2], c=assignments, s=50, alpha=0.5)
ax.plot(centroids[:, 0], centroids[:, 1], centroids[:, 2], 'kx', markersize=15)
plt.show()
Conclusion
I hope this post helped you understand the details of how to implement K-means in Tensorflow. I’m planning to put it to good use soon, so make sure to check it out!